ChimeraX Recipes
Quantify spots in 3D microscopy
This code adds a “spots” command to ChimeraX to identify spots in 3D microscopy data and report their intensity, volume, and position. It identifies the spots and quantifies them using the Segger tool in ChimeraX (menu Tools / Volume Data / Segment Map) which does watershed segmentation. That graphical user interface has no equivalent command, so the Python code below calls Segger to find the spots, then writes out comma-separated-values describing each spot.
Simple Example
Here is an example use. The “open spots.py” defines the new spots command
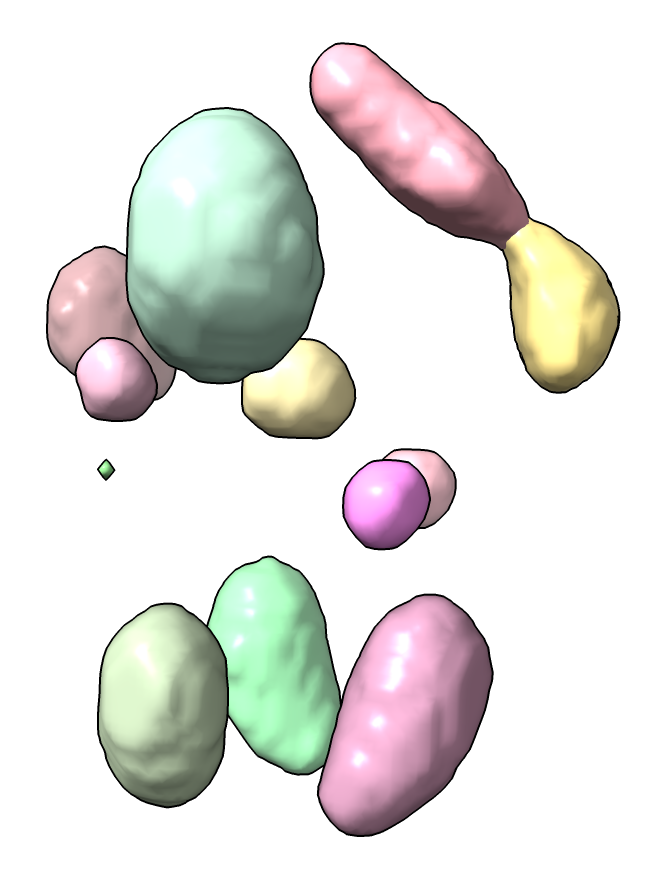
open 34550 from emdb
open spots.py
spots #1 threshold 10
with output of measurements for 13 spots that looks like
# Spot number, total intensity, mean intensity, max intensity, number of grid points, max x position, max y position, max z position
1,74.217,0.057712,0.076549,1286,86,70,84
2,62.173,0.053643,0.065282,1159,84,97,120
3,55.886,0.053174,0.0648,1051,105,105,118
...
13,0.046948,0.046948,0.046948,1,112,88,101
The threshold option of the spots command sets the number of standard deviations above the mean map value for segmenting the map. There is also a smooothingSteps option (default 0) that can reduce the number of spots by combining nearby ones, a typical value would be 3. The output gives the total intensity for each spot which is the sum of the map value at all grid points within the spot. It also gives mean intensity and maximum intensity for each spot, and the number of grid points in the map covered by the spot, and the grid x,y,z indices of the maxima for each spot.
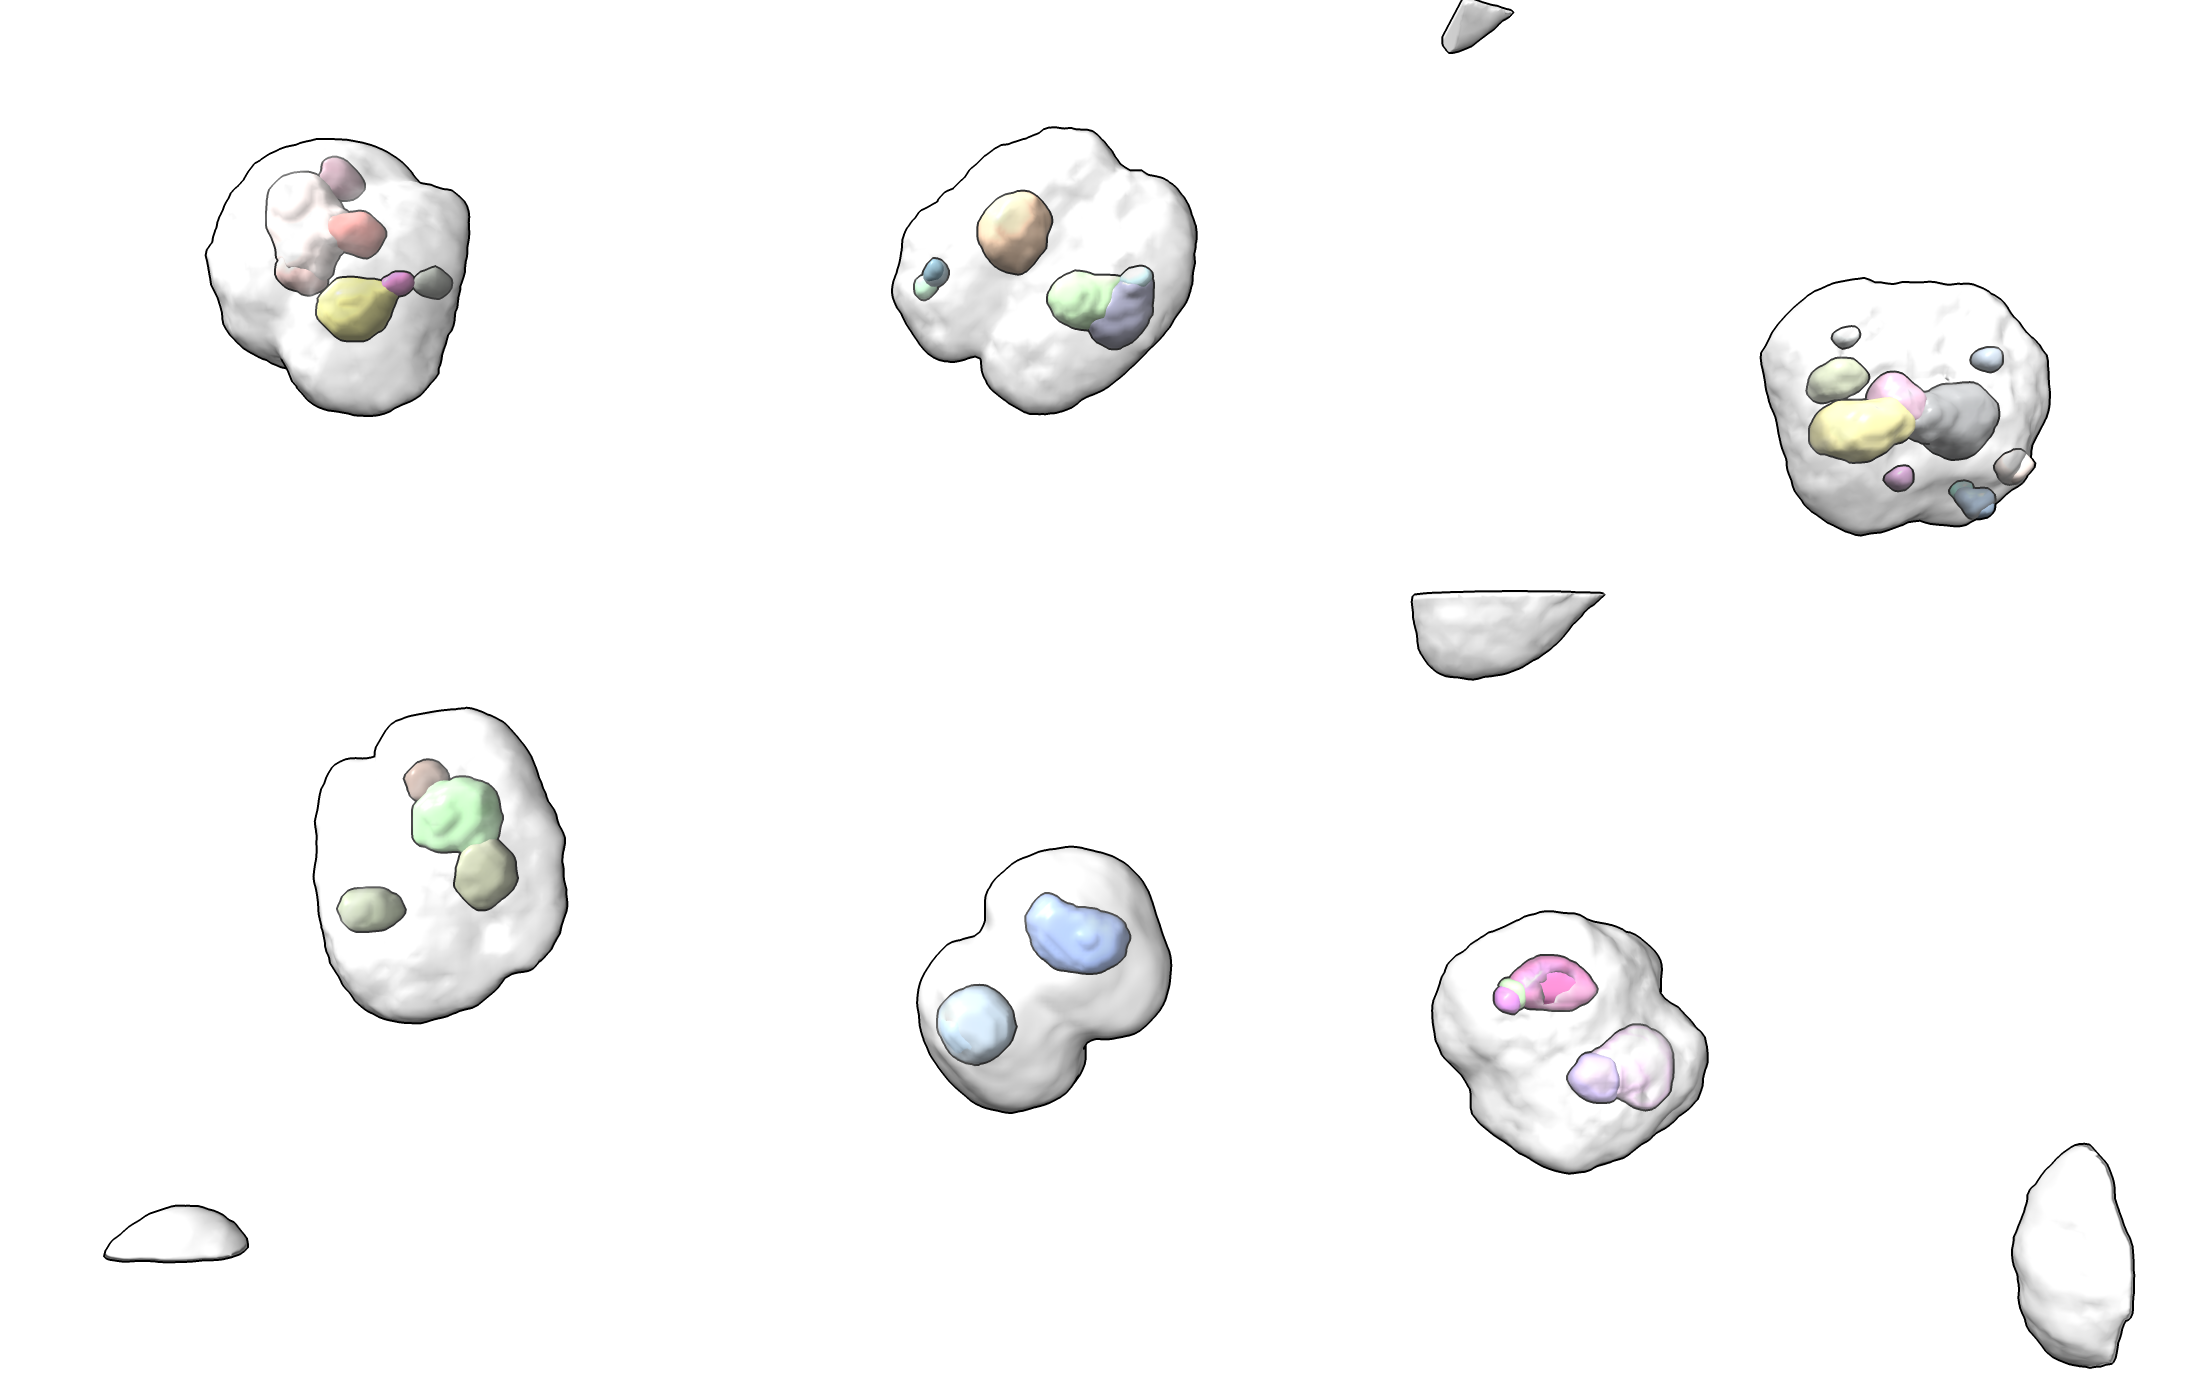
Light Microscopy Example for Processing Many 3D Images
This code was developed for Charles Arthur at UC San Francisco to look at foci of fluorescently labeled molecules in 3D light microscopy of hundreds of cells. Here is how to apply it to many maps in the same directory, writing a CSV file of spot measurements and an image for each map with file names matching the map file with suffixes .csv and .png. It uses the ChimeraX open command forEachFile option to run a set of ChimeraX commands after opening each file.
open spots.cxc forEachFile cell_*.tif
The microscopy image files are cell_*.tif and each has 4 channels (model numbers #1.1, #1.2, #1.3, #1.4) and we find spots in the second channel and make an image showing the first channel which is the cell membrane. The spots.cxc file contains the following ChimeraX commands that will be executed for each map.
spots #1.2 threshold 10 out "$file.csv"
# Save an image with the membrane
volume #1.1 style surface color lightgray transparency 0.8
hide #1.2-4 model
view
save "$file.png"
The cell images look like
Spots Python code
Here is the spots.py code that defines the spots command
# --------------------------------------------------------------------------------------
# Adds ChimeraX "spots" command to run Segger on a map to segment spots above a given
# threshold and output intensity, volume and position as comma-separated-values.
# This was written to segment puncta in 3D light-microscopy for Arthur Charles at UCSF.
# Example command
#
#     spots #1.2 threshold 10 output spots.csv
#
def spots(session, map, threshold_sdev = None, output_csv = None, smoothing_steps = 0):
    '''Segment light microscopy to quantify spots, report intensities.'''

    # Show map in surface style at desired threshold level at full resolution
    map.set_parameters(style = 'surface', step = 1)

    # Use threshold level of mean plus some number of standard deviations
    if threshold_sdev is not None:
        # Compute mean and standard deviation
        mean, sd = map_mean_and_sd(map)
        threshold = mean + threshold_sdev * sd
        map.set_parameters(surface_levels = [threshold])
    elif len(map.surfaces) == 0:
        map.update_drawings()        # Set initial threshold level

    # Run Segger watershed segmentation
    spots = segment_spots(map, smoothing_steps)

    # Log comma-separated values file of spots.
    lines = ['# Spot number, total intensity, mean intensity, max intensity, number of grid points, max x position, max y position, max z position']
    for i,spot in enumerate(spots):
        lines.append(str(i+1) + ',%.5g,%.5g,%.5g,%d,%d,%d,%d' % spot)
    results = '\n'.join(lines) + '\n'
    session.logger.info(results)

    if output_csv:
        with open(output_csv, 'w') as file:
            file.write(results)

def segment_spots(map, smoothing_steps = 0):
    '''
    ChimeraX does not have a command to run the Segger segmentation so do it with Python.
    '''
    from chimerax.segger import segment_dialog
    d = segment_dialog.volume_segmentation_dialog(session, create=True)
    d._map_menu.value = map
    d._num_steps.value = smoothing_steps
    d.cur_seg = None                                # Don't reuse previous segmentation
    segmentation = d.Segment()

    # Put segmentation at same level as map for convenience when
    # showing multiple data sets.
    if segmentation.parent is not map.parent:
        session.models.add([segmentation], parent = map.parent)

    # Quantify each region.
    spots = []
    for region in segmentation.regions:
        ijk = region.points()
        num_grid_points = len(ijk)
        im,jm,km = region.max_point
        m = map.matrix(step = 1)
        from numpy import float64
        mean = m.mean(dtype=float64)
        map_values = m[ijk[:,2],ijk[:,1],ijk[:,0]]
        total_intensity = map_values.sum() - num_grid_points * mean
        mean_intensity = map_values.mean(dtype=float64) - mean
        max_intensity = m[km,jm,im] - mean
        spots.append((total_intensity, mean_intensity, max_intensity, num_grid_points, im, jm, km))

    # Sort from largest to smallest intensity.
    spots.sort(reverse = True)

    return spots

def map_mean_and_sd(map):
    m = map.matrix(step = 1)
    from numpy import float64
    mean = m.mean(dtype=float64)
    sd = m.std(dtype=float64)
    return mean, sd

def register_command(session):
    from chimerax.core.commands import CmdDesc, register, FloatArg, SaveFileNameArg, IntArg
    from chimerax.map import MapArg
    desc = CmdDesc(required= [('map', MapArg)],
                   keyword = [('threshold_sdev', FloatArg),
                              ('output_csv', SaveFileNameArg),
                              ('smoothing_steps', IntArg)],
                   synopsis = 'quantify spots in volume data')
    register('spots', desc, spots, logger=session.logger)

register_command(session)
Tom Goddard, November 6, 2023